master thesis
Summary
My master’s thesis introduces a method for assessing urban cycling infrastructure by analyzing mobility data in the city of Salzburg. The core idea is to compare the shortest possible bike routes with “bikeability-optimized” routes between origins and destinations derived from commuter and mobile phone data. By identifying where significant detours are necessary to find safer or more comfortable cycling paths, the method pinpoints specific road segments that are critical to the network but lack adequate infrastructure, offering a data-driven basis for urban planning decisions.
Key points
- Data-Driven Methodology: The thesis utilizes two main origin-destination (OD) datasets: commuter data from Statistik Austria and mobile phone data from the network provider Drei. This dual-source approach allows for a comprehensive analysis of both regular commuting patterns and general daily travel.The bike infrastructure data is based on OpenStreetMap and processed with the NetAScore tool to calculate a “bikeability index” for each road segment.

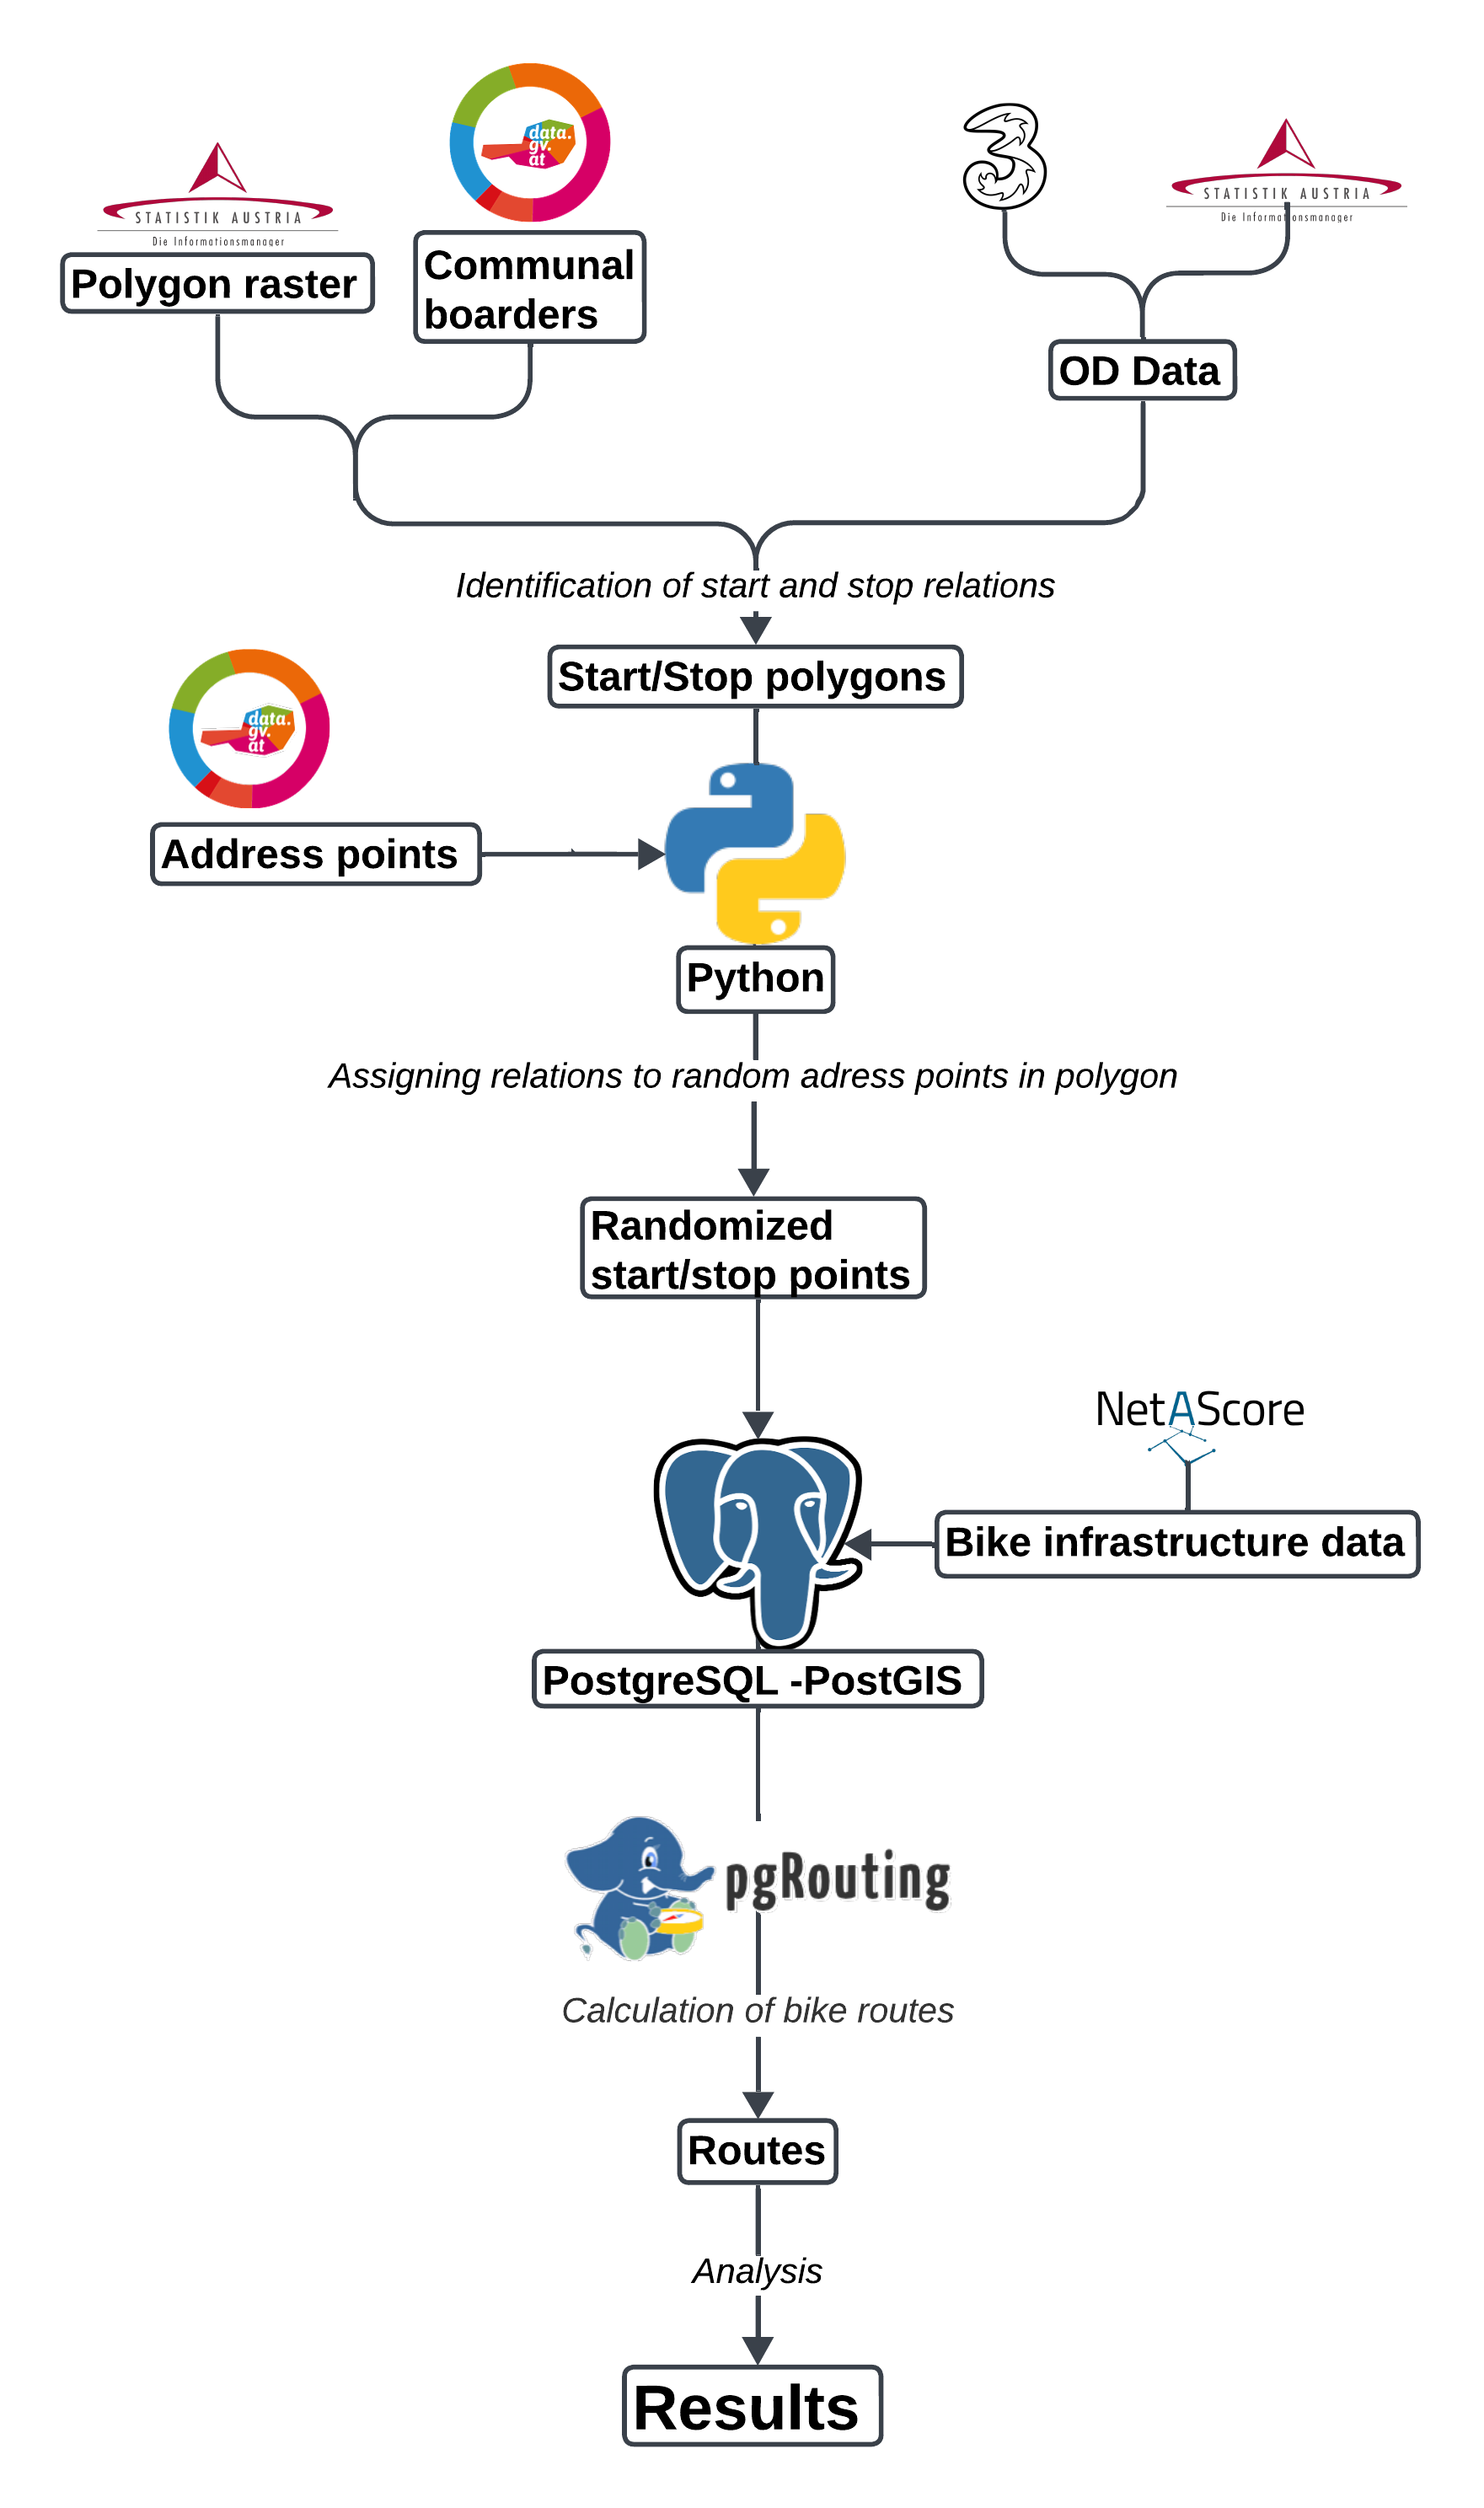
The overall workflow, from raw mobility data and spatial geometries to the final assessment results.
- Comparative Routing: For every origin-destination pair, two routes are calculated using a custom pgRouting function: 1) the shortest possible path, and 2) a bikeability-optimized path that prioritizes segments with higher safety and comfort scores, while limiting detours.The difference in distance and bikeability between these two routes is a key metric for the analysis.
Differences between shortest and optimal bike routes, Statistik Austria, 40221 total routes
| Statistic | Length (m) shortest route | Avg. bikeability shortest | Length (m) optimal route | Avg. bikeability optimal | Detour-multiplier | Difference in bikeability |
|---|---|---|---|---|---|---|
| Mean | 4500.06 | 0.515658 | 5426.65 | 0.735589 | 1.20564 | 0.219931 |
| Median | 3709.17 | 0.524007 | 4546.14 | 0.757893 | 1.14741 | 0.213021 |
| St dev (pop) | 3262.74 | 0.115431 | 3897.78 | 0.103314 | 0.211096 | 0.129607 |
| St dev (sample) | 3262.78 | 0.115431 | 3897.83 | 0.103316 | 0.211099 | 0.129608 |
| Minimum | 8.16113 | -1 | 8.16113 | -1 | 0.811295 | -0.0610443 |
| Maximum | 24619.1 | 0.9375 | 30848.8 | 0.9375 | 4.45449 | 0.720808 |
| Range | 24611 | 1.9375 | 30840.6 | 1.9375 | 3.6432 | 0.781852 |
| Q1 | 2279.84 | 0.445409 | 2682.63 | 0.695192 | 1.06863 | 0.123843 |
| Q3 | 5714.74 | 0.589123 | 7020.84 | 0.801918 | 1.27174 | 0.312561 |
| IQR | 3434.89 | 0.143714 | 4338.21 | 0.106726 | 0.203106 | 0.188717 |
- Segment-Level Analysis : Route-level data is disaggregated to the segment level. For each road segment, metrics are calculated, including the total number of trips/commuters, the average detour required by those travelers, and the segment’s own bikeability score.

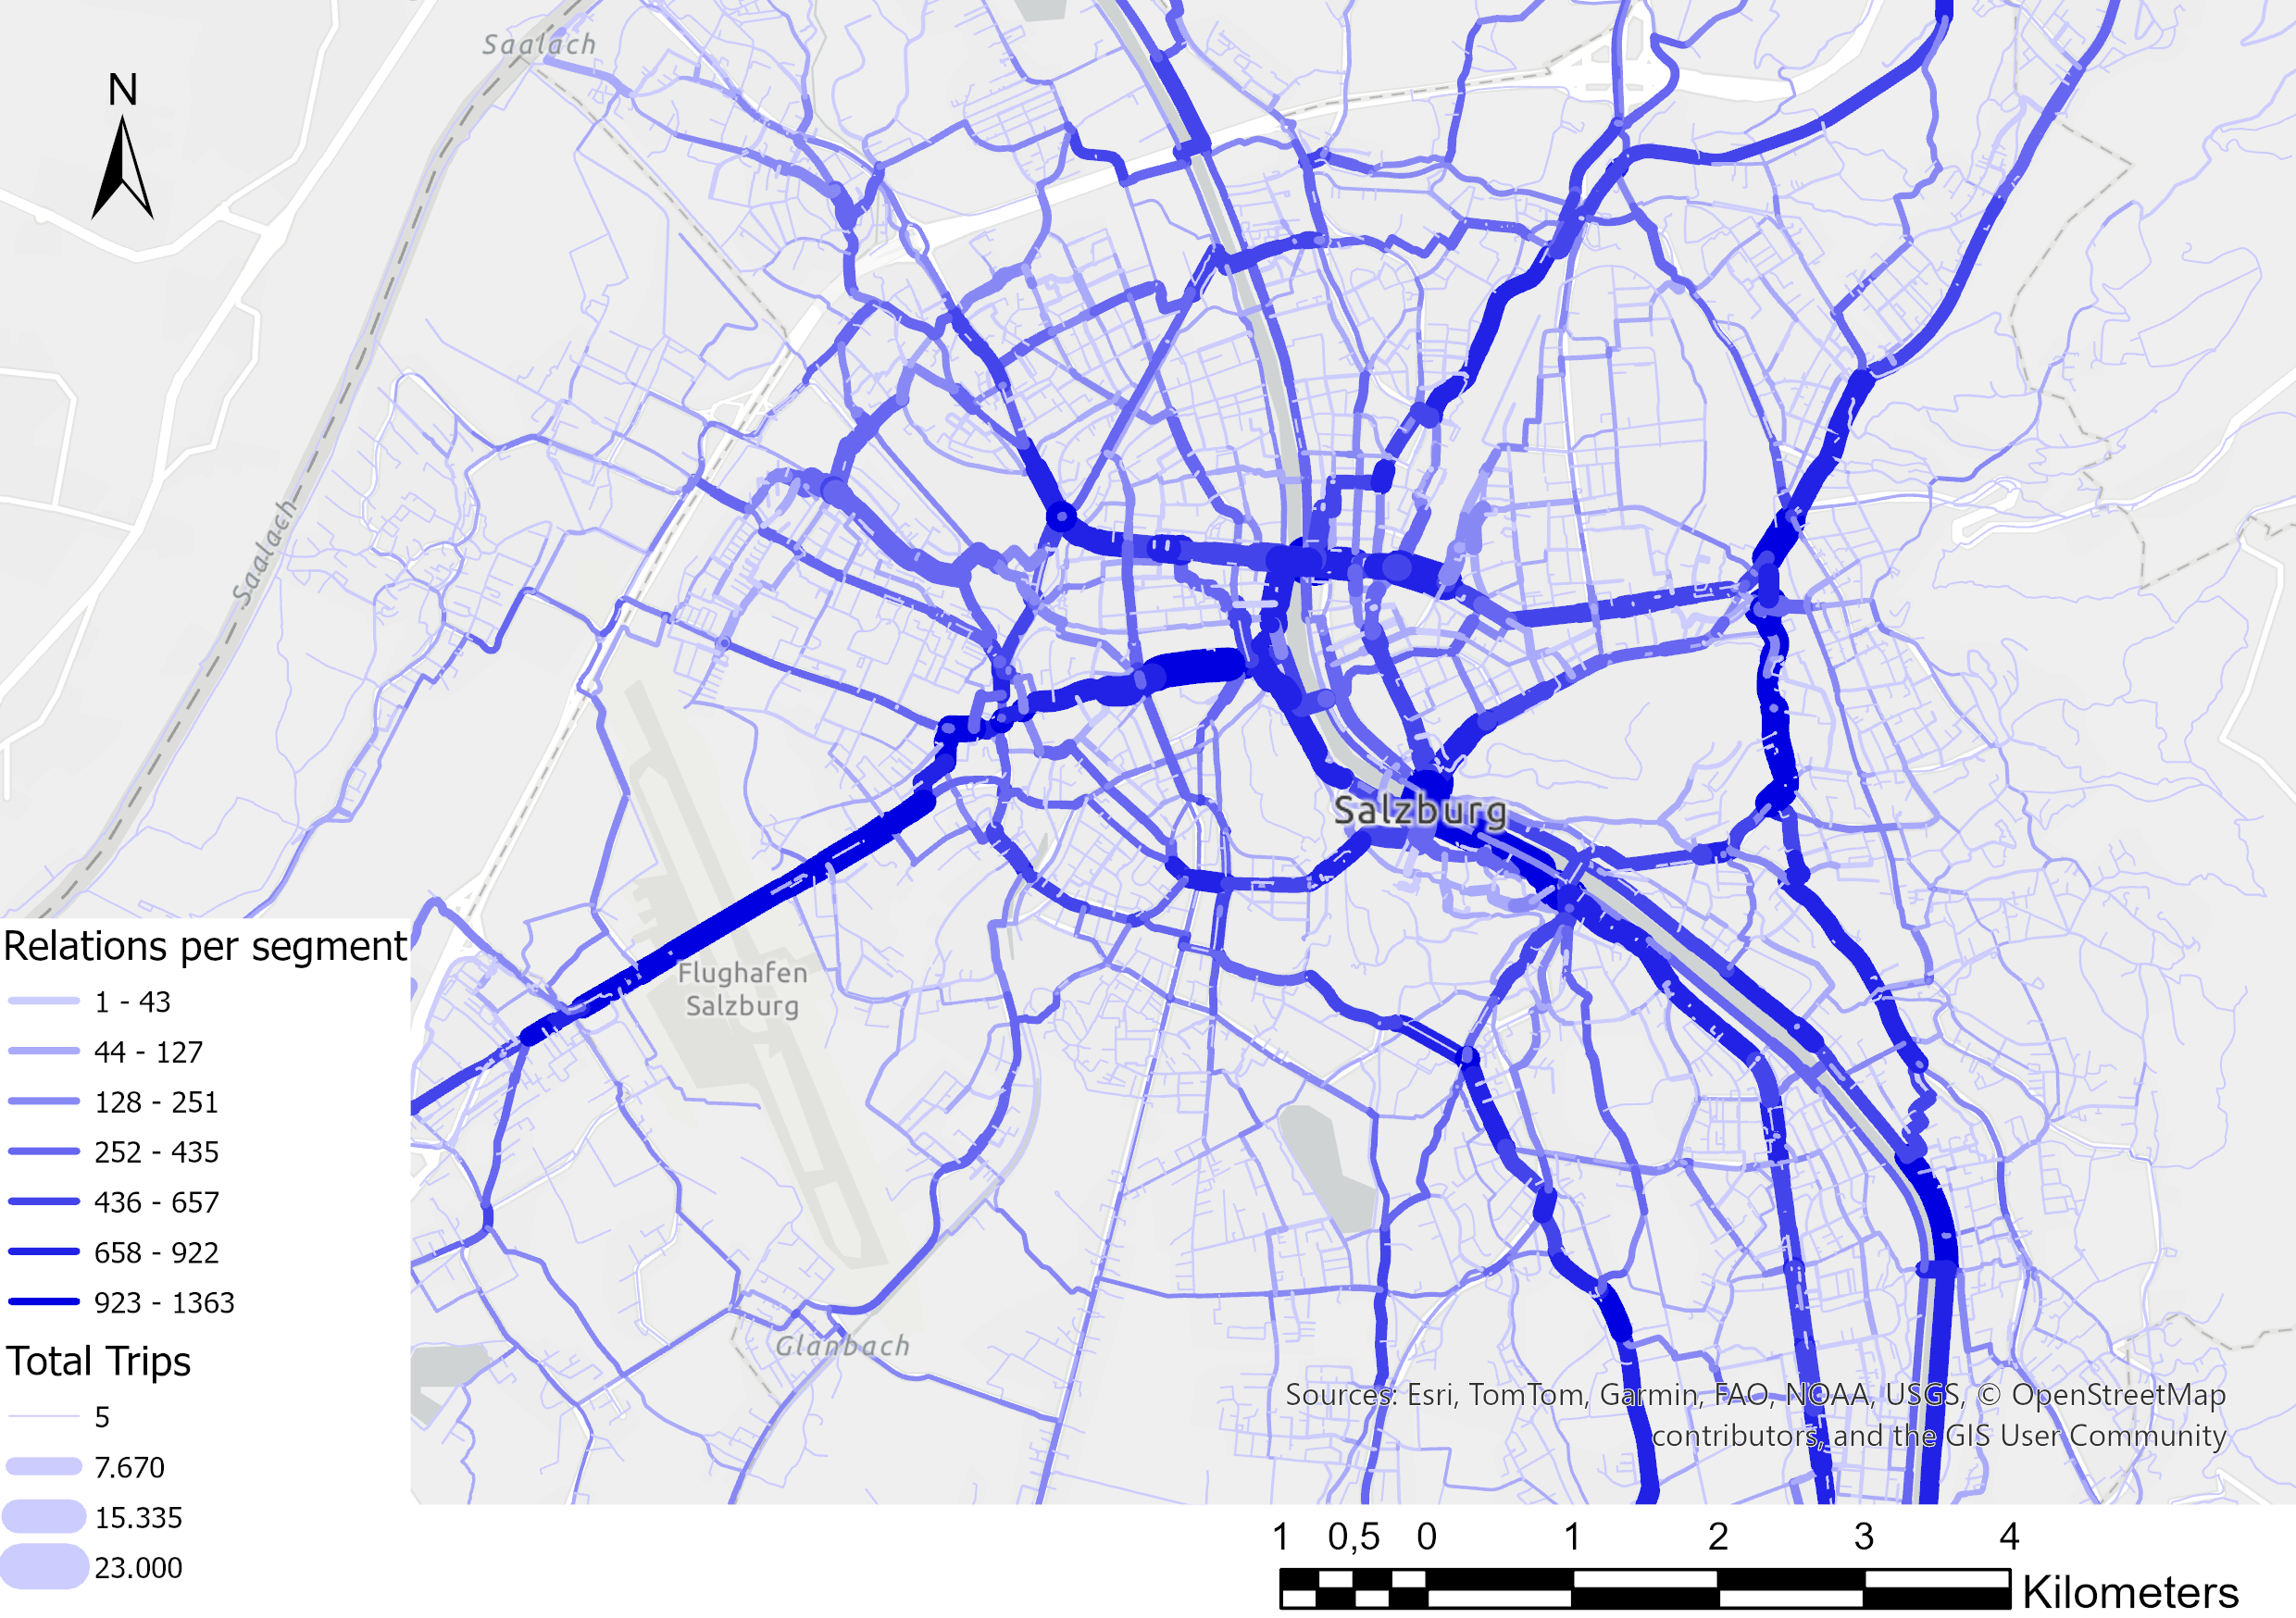
Visualization of commuter flow on the shortest routes, with line thickness representing the total number of trips per segment.
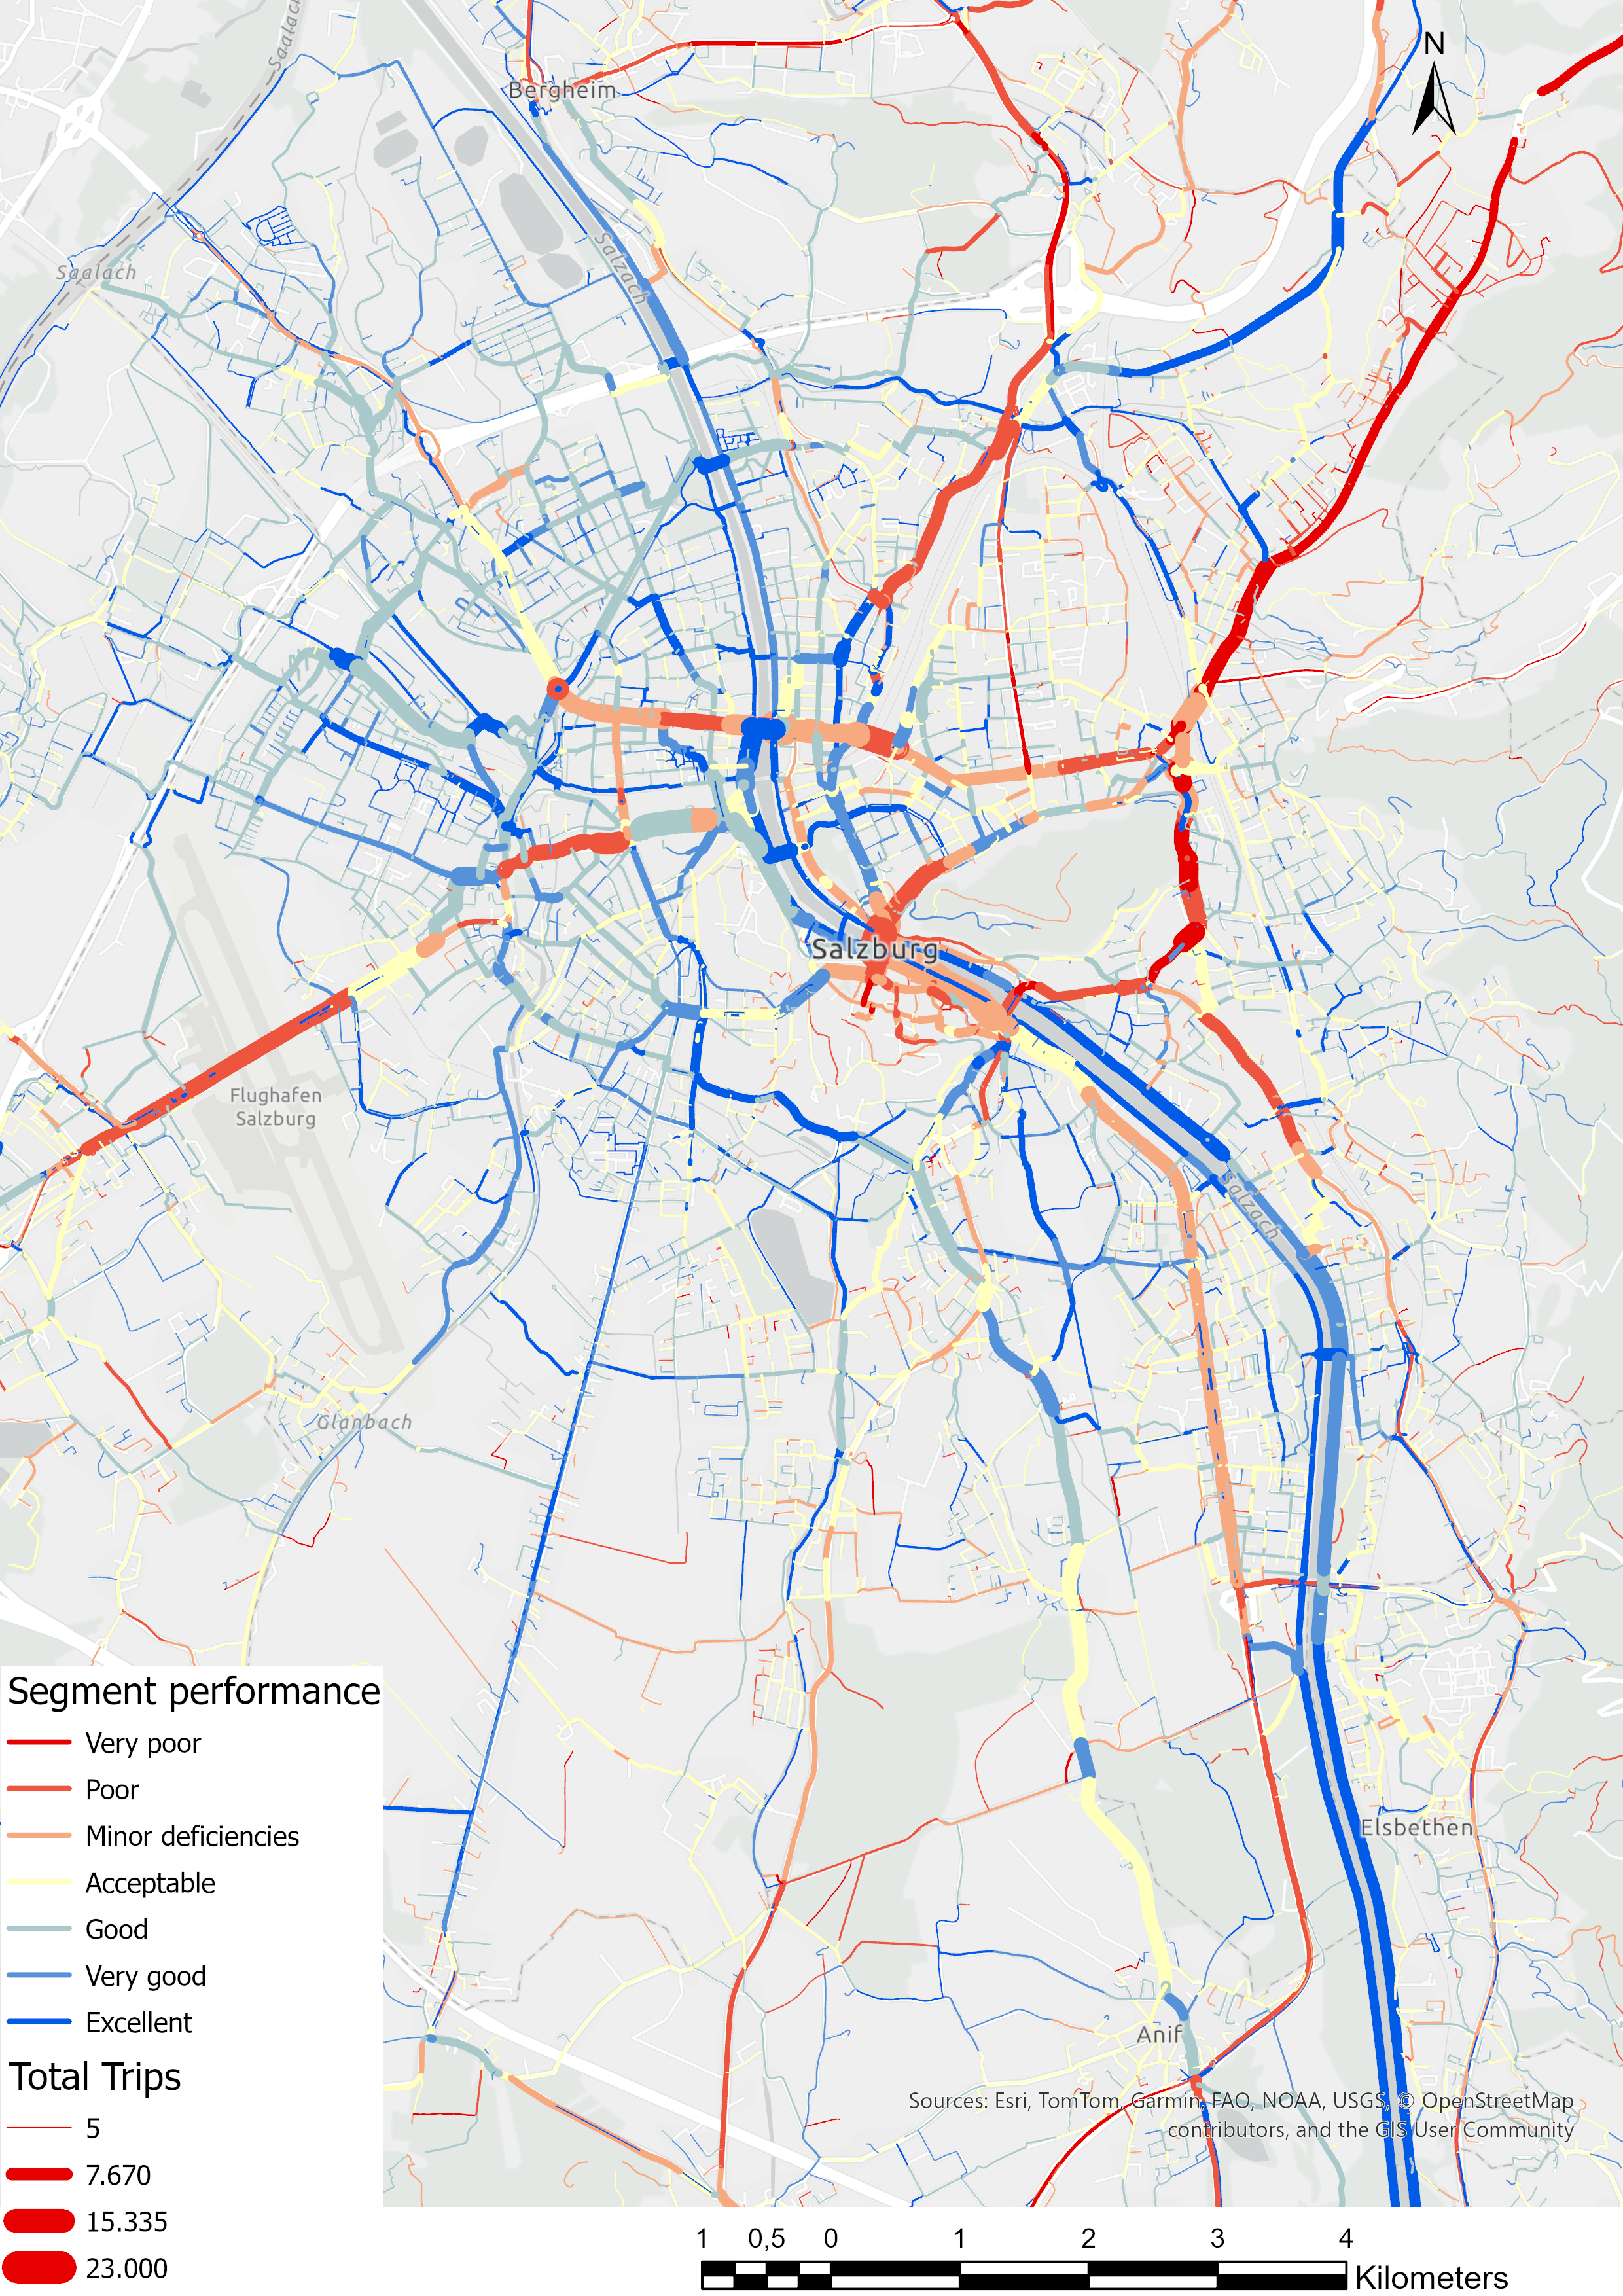
- Composite Performance Indicator: A composite indicator was developed to evaluate each segment’s overall performance. It integrates the segment’s bikeability, penalizes it for being part of routes with long detours, and adjusts the score based on its quality relative to the routes it serves. This allows for a nuanced assessment that highlights the most critical and underserved segments.

The final map visualizes the segment performance indicator. Red indicates very poor performance, while blue indicates excellent performance. Line thickness corresponds to the number of trips per segment.
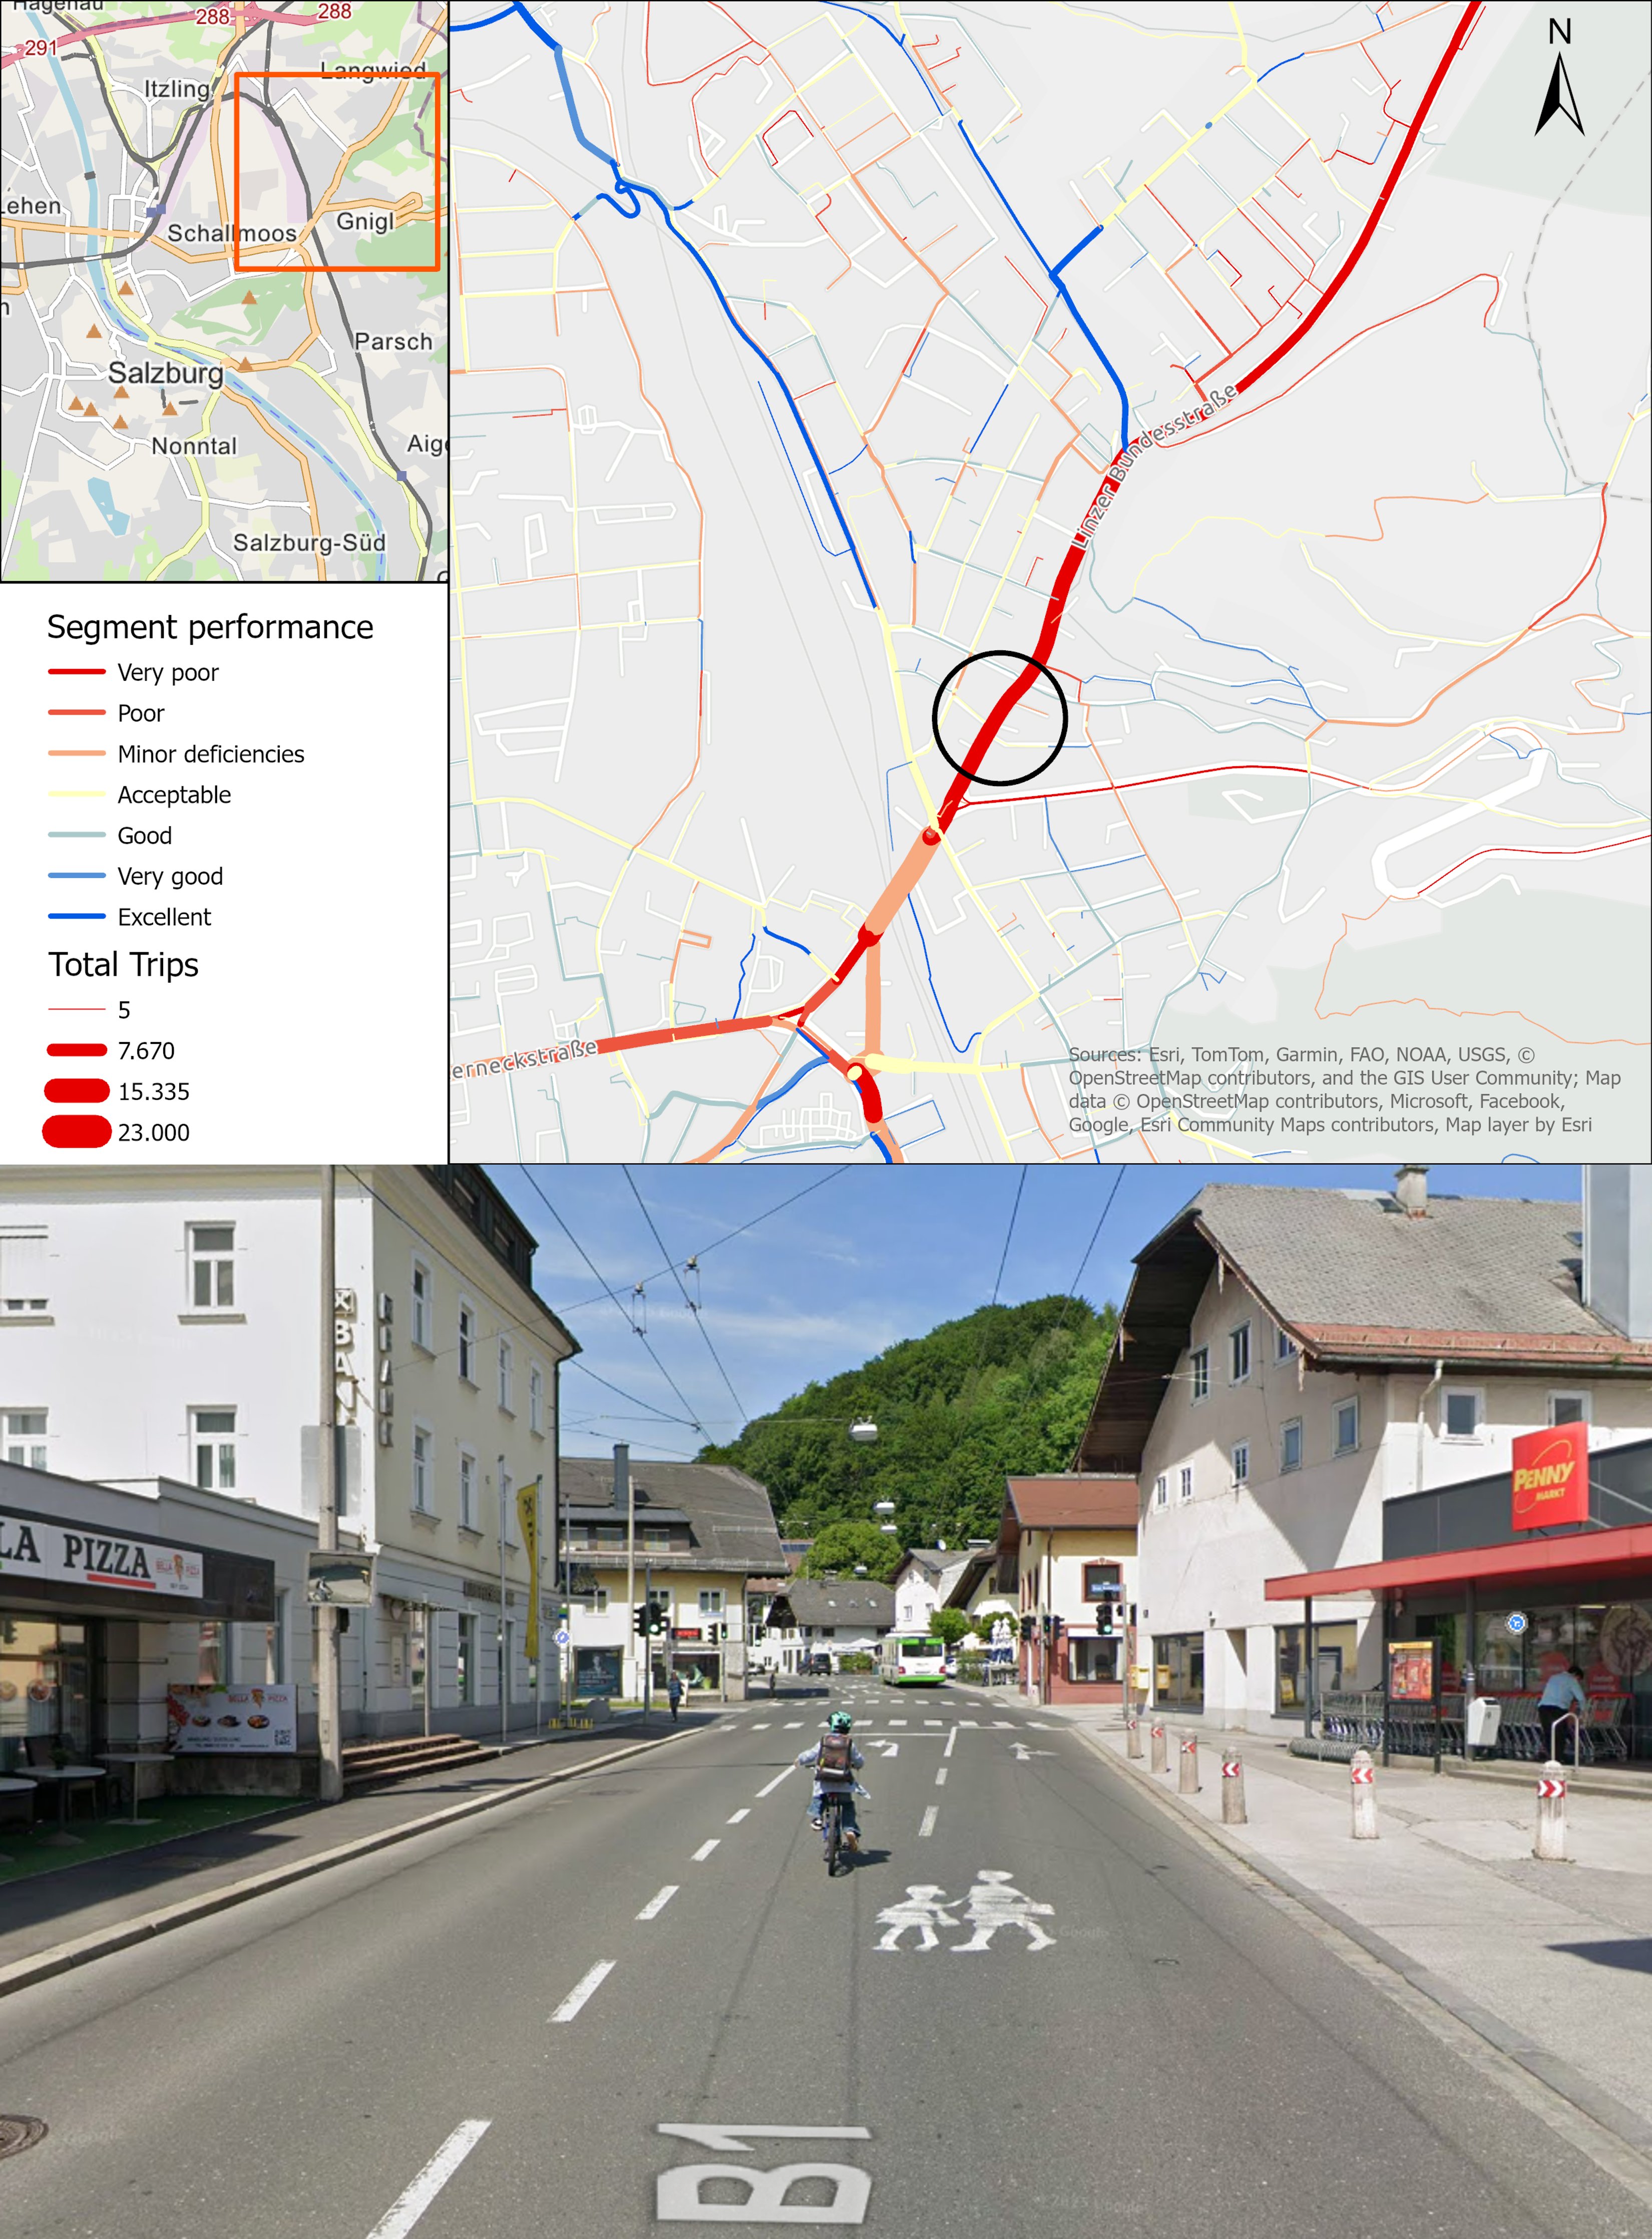
- Identifying Insufficient Infrastructure : The final visualizations and SQL queries successfully identify significant road segments with poor infrastructure.For example, a highly traversed in the Gnigl is classified as “very poor” due to its low bikeability and the significant detours required for a better alternative, a finding confirmed by on-the-ground conditions.

An excerpt of the segment performance map and Google Street View image corresponding to athe segment identified as having very poor performance, showing a lack of dedicated cycling infrastructure on a busy road.
Full PDF:
Coming soon!